TStudying Boulder Clay
tutor: Mike Horne FGS
for the Centre for Life Long Learning
Why do it?
The boulder clay is the dominant geology of Holderness.
Careful study will help us to identify the three boulder clays (Tills) and perhaps derived Tills included within them.
A study of the erratics can tell us about the directions of ice movements.
A study of the till fabrics and tell us about the direction of local ice movements.
There may be erratics in the boulder clays that are not found on land.
Methods and Accuracy
Let's be honest - when you look at Boulder Clay it is hard to tell the different deposits apart. So studying the Glacial Tills in detail requires establishing some means of separating them - and the best way to do that is using statistics. We cannot always take huge samples back home with us so we have to start our statistical analysis in the field. It is important that we understand sources of bias in our statistics.
Logging :-
Record the thicknesses of the beds of Till and other deposits that you can see.
Look for structures and sedimentary features. As with all logging pay particular attention to the boundaries between beds - are there signs of erosion. Look also for sheering - caused by the glacier pushing one till over another. This may be associated with other structures such as folding and folding.
For each bed - describe the overall colour, variety of clast sizes, dominant erratics. Also look for and record erratics that you can identify as being from particular locations or geological ages. Pay attention to the textures and shapes of these - are the polished, do they have scratches on them, &c.
When you find elongated erratics in the Till - record the direction of the long axis - this is an indicator of the glacier's direction of movement.
What is Till?
It might seem to be a strange time to be asking this question - but it is something that we should consider carefully. On the one hand we can simply say that it is a mixture of Boulders and Clay - hence the name Boulder Clay. But perhaps we need to think about how it formed? Could it be more than the result of a Glacier melting and leaving its payload behind?
As a sediment Boulder Clay is very unusual - most sediments have been sorted so that there is not such a variety of clast sizes. How could this happen?
And where did the glacier get all the material from anyway? Did it bring the erratics from exotic locations in one event or is it the result of the recycling of previous Tills from older glaciations plus sediments scraped out of the (at that time) dry bed of the North Sea mixed in with sediments derived during the last cold phase?
Work with erratics (pebble counting) :-
Listing the erratics seen on the beach at each locality (as carried out by the East Riding Boulder Survey*). This tends to be the most subjective sort of survey with several possible sources of error - accuracy of location; erratics on the beach can be from any of the tills or transported by long shore drift; small or delicate erratics are lost or ignored; there is no notion of proportions so it gives no impression that rarity of some erratics; it depends on the knowledge of the surveyor.
Listing the erratics seen in the cliff or beach exposures of boulder clays. This reduces the contamination and mixing; increases the size range; but the surveyor may not know which Till she/he is sampling. Again it does depend on the knowledge of the surveyor - we all have a tendency to ignore the erratics we do not recognise.
Listing the erratics seen in situ in a particular Till following on from logging the sequence and identifying beds.
A statistical count of erratics in any the above situations - will give proportions, but may still be influenced by the knowledge of the surveyor.
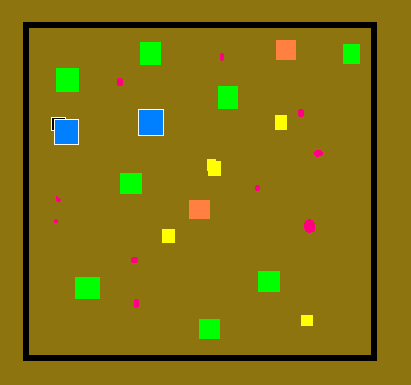
A statistical count or erratics in a particular size range either in an defined area (e.g. 1 metres square). If this is done with known examples of each Till (e.g. from their type localities) this can provide a standard for comparison with Tills in other localities. Every erratic in the area selected would have to be counted including the boring looking ones. If a record of their size is kept then a percentage of each rock type could be estimated and also the percentage of erratics to matrix. The disadvantage of this is that the rarer (sexy) erratics that can tell us where the glacier has come from will probably be missing.
Having counted, measures and identified the erratics we can then tabulate the results as a simple count or as a percentage by area:
|
Erratic
|
number
|
percentage
|
| Blue |
2
|
4%
|
| Green |
8
|
32%
|
| Orange |
2
|
4%
|
| Pink |
10
|
40%
|
| Yellow |
4
|
16%
|
|
total
|
26
|
|
Erratic
|
number
|
"diameter"
|
total
|
percentage |
| Blue |
2
|
5cm | 50cm2 |
0.5%
|
| Green |
8
|
5cm | 200cm2 |
2%
|
| Orange |
2
|
5cm | 50cm2 |
0.5%
|
| Pink |
10
|
1cm | 10cm2 |
0.1%
|
| Yellow |
4
|
2.5cm | 25cm2 |
0.25%
|
|
Matrix
|
|
the rest!
|
96.25%
|
Bulk Sampling -
Collecting samples of the Till and then carrying out lab analysis. Working on the larger fractions is possible for the amateur at home, but separating and analysing the clay and silt fractions requires specialist equipment. Professional quality sieves cost about 50 pounds each and you will need a set of them, but it can be done with home-brewing mesh bags, kitchen sieves and garden sieves - the important aspect is treating all the samples with a consistent method. This is the most accurate of the methods discussed here - but will take longer and may block your drain with clay!
Method - dry the bulk sample, weigh it, put part of it aside, wet sieve it at 63um, dry it, sieve it dry into fractions [see grain size chart], weigh the fractions and identify the clasts in east fraction for statistical purposes. You can also treat a subsample of the Till with acid (1 M hydrochloric or acetic) to remove the carbonate fraction (though HCl will probably remove the phosphates too).
This will give you the proportions of Clay/Silt, sand, gravel, pebbles, and carbonate in the sample. [NOTE - the following charts are examples, you will have to use your own judgment about that to include. Consider doing this using a data base with more detail first and then picking out the significant features for your report]
|
Sample No.
|
clay/silt %
|
sand %
|
granules%
|
cobble %
|
carbonate %
|
|
1
|
|||||
|
2
|
|||||
|
3
|
You can also tabulate the percentages of the erratics in the samples -
|
Sand grains
|
|
Sample no.
|
clear sharp Qz % | cloudy Qz % | yellow Qz % | heavy mins % | chalk % |
|
1
|
|||||
|
2
|
|||||
|
3
|
for the different fractions
|
Granules
|
|
Sample no.
|
chalk % | sandstone % | yellow Qz % | igneous % | coal % |
|
1
|
|||||
|
2
|
|||||
|
3
|
There are also methods that you can use to determine the proportion of silt to clay.
Note:- for the statistics to be accurate there would have to be a count of over 100 grains/stones, perhaps 300 would be best. There may be differences in the different size fractions - e.g. coal might be absent in a > 50mm fraction but common in a 10mm fraction. Some Tills may contain more clay than boulders.
If you had access to the equipment you could determine the proportions of the different clay minerals present in the Till.
Further reading:-
Bridgeland D R (ed) 1986. Clast Lithological Analysis. Quaternary Research Association Technical Guide No. 3. 207pp.
copyright Mike Horne - 2019
Hull Geological Society Home Page Geology Courses Homepage